Redistricting maps considered
According to the 2020 census data, the total city population equals 33,830, which means each of the five City Council districts in every alternative has a target population of 6,766. Below are several different map alternatives that draw the lines in different ways, but with district populations remaining within the legally required 10% variation between the lowest and highest populations.
Final redistricting map adopted
On April 7, 2022, the Independent Redistricting Commission selected a proposed final map and provided findings for a preliminary redistricting plan. Pursuant to Elections Code 21608, the city published the proposed final map and preliminary redistricting plan for a seven-day public comment period.
The commission adopted the final redistricting map (Public 131.1_ID121034(PDF, 795KB)) on April 14, 2022.
Draft maps previously considered
Note: After downloading and opening each file, it may take a moment for the districts layer to appear. The second page of each map provides demographic information for the proposed districts.
Maps removed from consideration by vote of the commission
- Public 101_ID99632(PDF, 840KB)
- Public 102_ID100938(PDF, 843KB)
- Public 105_ID106085(PDF, 840KB)
- Public 108_ID111421(PDF, 842KB)
- Public 109_ID36165(PDF, 835KB)
- Public 110_ID93613(PDF, 869KB)
- Public 115_ID117110(PDF, 736KB)
- Public 115.1_ID117110(PDF, 741KB)
- Public 117_ID117667(PDF, 739KB)
- Public 117.1_ID117667(PDF, 735KB)
- Public 120_ID118352(PDF, 738KB)
- Public 120.2_ID121142(PDF, 743KB)
- Public 121_ID118433(PDF, 738KB)
- Public 121.1_ID121139(PDF, 743KB)
- Public 124_ID118591(PDF, 738KB)
- Public 125_ID118892(PDF, 764KB)
- Public 127_ID120596(PDF, 742KB)
- Public 128_ID120732(PDF, 744KB)
- Public 130_ID121002(PDF, 742KB)
- Public 131_ID121034(PDF, 739KB)
- Public 131.1_ID1221034(PDF, 740KB)
- Public 131.2_ID121034(PDF, 742KB)
- Public 132_ID121183(PDF, 742KB)
- Public 134_ID121194(PDF, 741KB)
- Menlo Park Plan B2(PDF, 739KB) (created by the demographer)
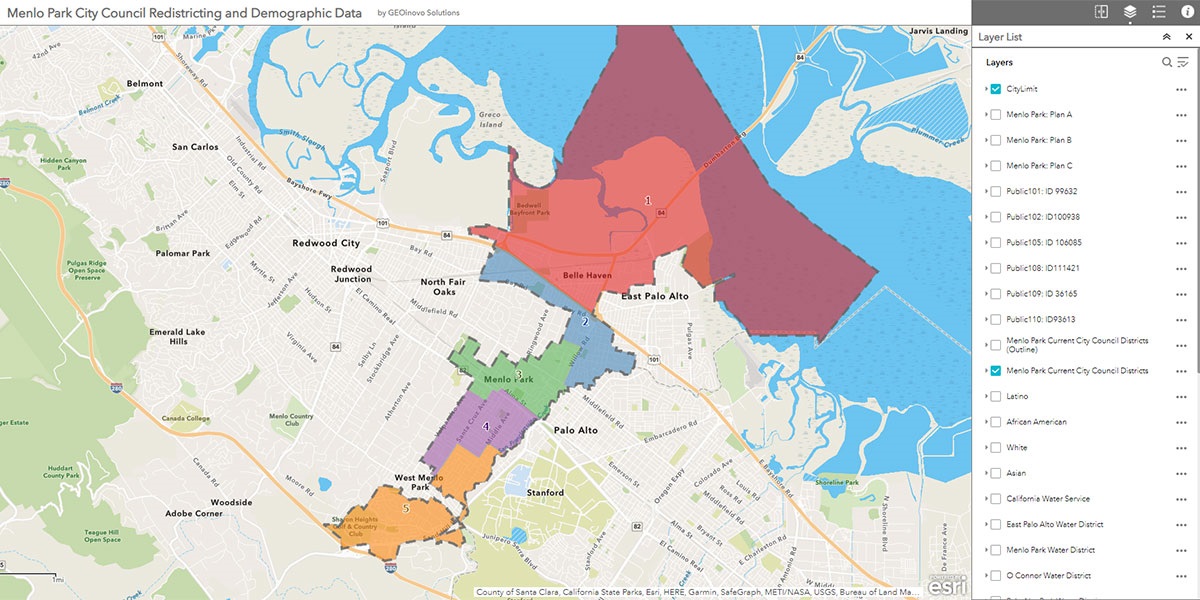
This interactive map provides comparisons between current districts and all draft maps submitted and processed thus far.
Demographic data for draft maps
View the population data by district(PDF, 234KB) and the California voting age population data by district(PDF, 218KB) for each of the submitted draft maps.